★★★★★
Rated 4.9/5 . 500+ verified traders


$450k+ Paid to traders worldwide
⚡ Industries Cheapest Instant Funding
The Relative Strength Index (RSI) is one of the most popular momentum oscillators in technical analysis. Developed by J. Welles Wilder Jr. in 1978, it measures the speed and magnitude of recent price changes to evaluate overvalued or undervalued conditions in the price of a financial asset.
However, despite its popularity, the RSI is widely misunderstood. Many beginner traders fall into the trap of using it as a standalone signal, buying simply because the indicator drops below 30, or selling because it crosses above 70. In modern algorithmic markets, this simplistic approach often leads to steep losses.
In this guide, we will break down how professional traders actually use the RSI in 2026, the best settings for different trading styles, and how to combine RSI with market structure to pass your next prop firm challenge.
Understanding the RSI Formula and Settings
The RSI oscillates between zero and 100. It is calculated using the average gain and average loss over a specified lookback period.
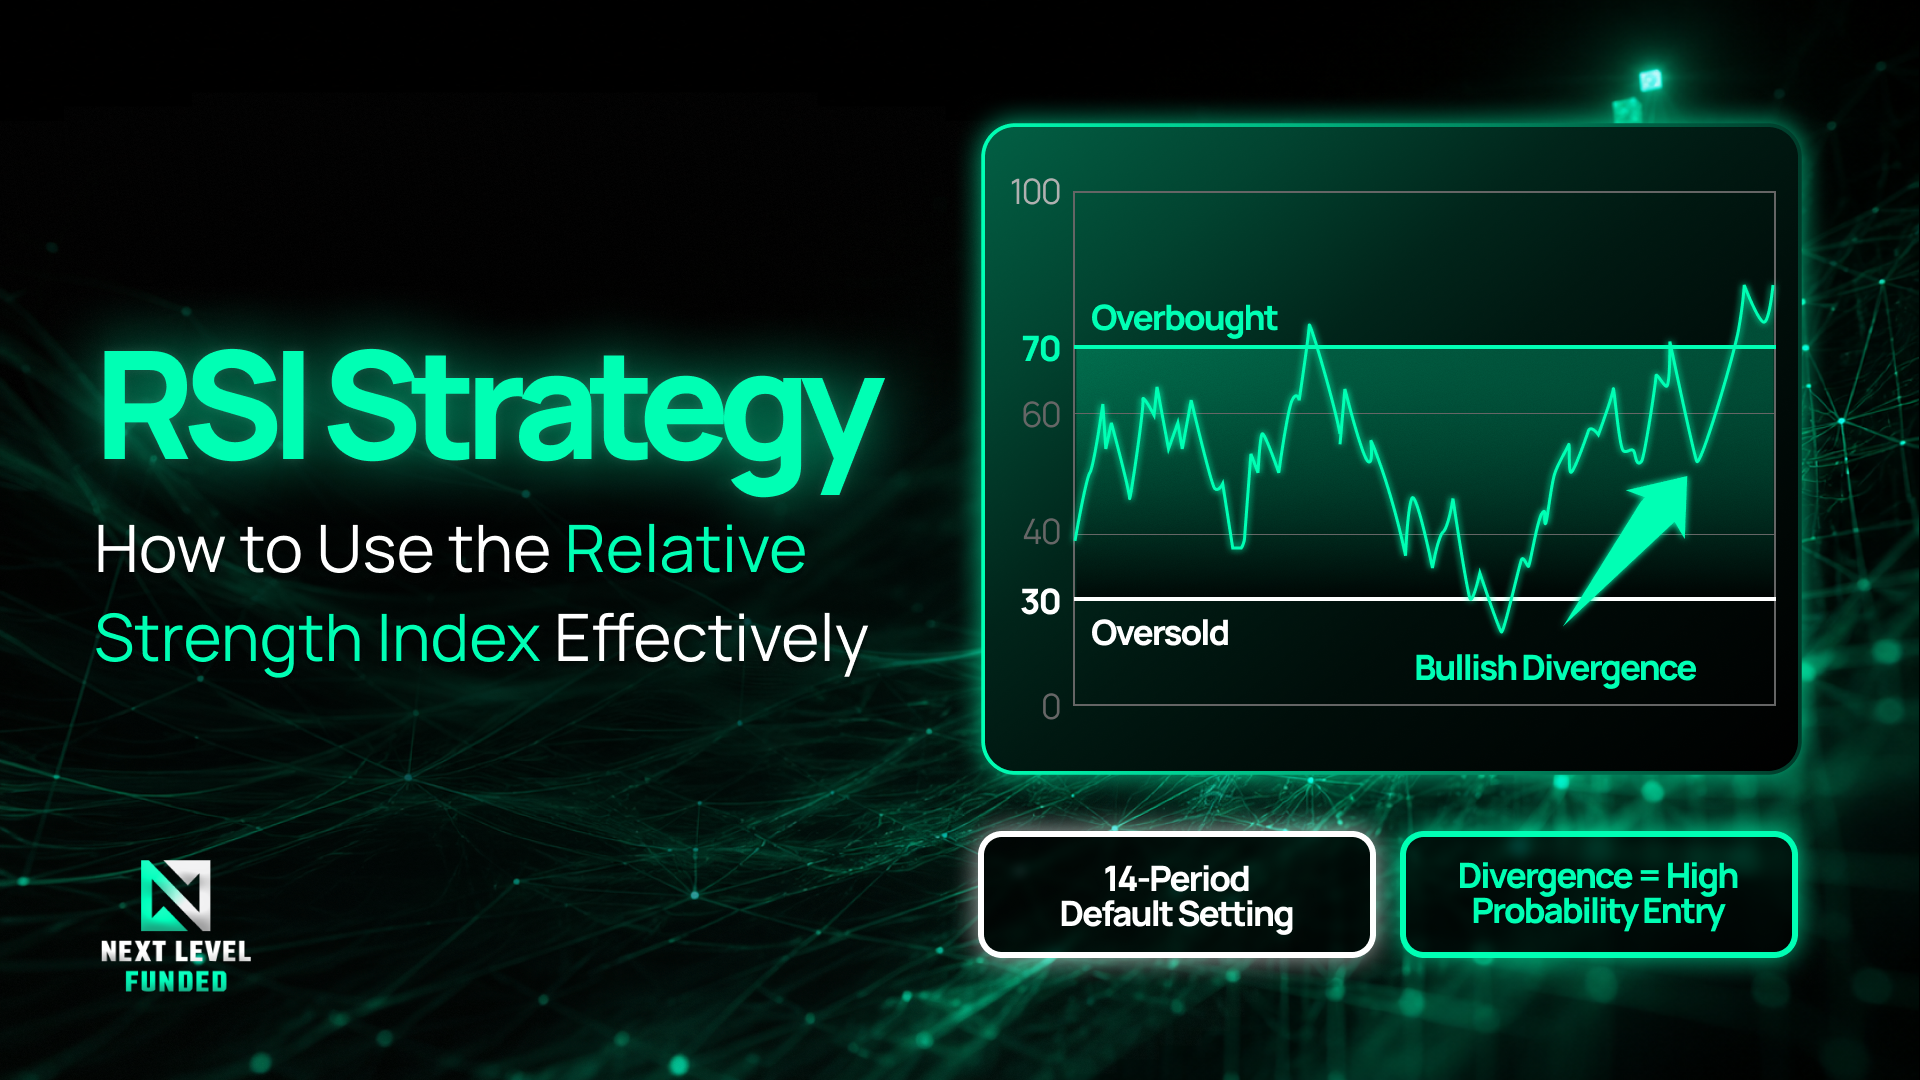
The standard, default setting for the RSI is 14 periods. This means on a 1-hour chart, the RSI calculates momentum based on the last 14 hours of price action. On a daily chart, it uses the last 14 days.
The Best RSI Settings for Different Trading Styles
While 14 is the default, professional traders often adjust the lookback period to suit their specific trading style and the volatility of the asset they are trading.
The Flaw in the "Overbought vs. Oversold" Myth
The most common advice given to new traders is: "Buy when RSI is below 30 (oversold) and sell when RSI is above 70 (overbought)."
This is a dangerous oversimplification. In a strong, sustained uptrend, an asset can remain "overbought" (above 70) for days or even weeks. If you blindly sell just because the RSI hits 75, you will get run over by the trend. Conversely, in a strong downtrend, an asset can stay "oversold" for extended periods.
RSI extreme levels do not mean an immediate reversal is imminent; they simply indicate strong momentum in that direction.
The Professional RSI Strategy: Divergence
If overbought and oversold levels aren't reliable entry signals on their own, how should you use the RSI? The answer is RSI Divergence.
Divergence occurs when the price of an asset moves in the opposite direction from the RSI indicator. It is one of the most powerful leading indicators of a potential trend reversal.
Bullish RSI Divergence
Bullish divergence occurs in a downtrend when the price makes a lower low, but the RSI makes a higher low.
- What it means: The downward price momentum is exhausting. Sellers are losing control, and a bullish reversal is highly probable.
- How to trade it: Wait for a break of market structure (a higher high in price) to confirm the reversal, then enter long.
Bearish RSI Divergence
Bearish divergence occurs in an uptrend when the price makes a higher high, but the RSI makes a lower high.
- What it means: The upward price momentum is fading. Buyers are exhausted, and a bearish pullback or reversal is likely.
- How to trade it: Wait for the price to break below recent support, confirming the shift in momentum, then enter short.
Combining RSI with Market Structure
No indicator should be used in isolation. The most robust RSI strategy combines momentum readings with raw price action and market structure.
- Identify the Higher Timeframe Trend: Use the 4-hour or Daily chart to determine the overall market direction.
- Wait for a Pullback: If the trend is bullish, wait for price to pull back into a key support zone, order block, or Fair Value Gap (FVG) on the 15-minute or 1-hour chart.
- Look for Divergence: As price hits that support zone, look for Bullish RSI Divergence. This confirms that the selling pressure of the pullback is dying exactly where you expect buyers to step in.
- Execute with Proper Risk: Enter the trade with a stop loss placed below the recent swing low, targeting a 1:2 or 1:3 Risk-Reward ratio.
Scale Your RSI Strategy with Next Level Funded
Mastering the RSI takes practice, discipline, and capital. Once you have backtested your RSI divergence strategy and proven you have an edge, the next step is scaling your profits.
At Next Level Funded (NLF), we provide talented traders with the capital they need to make a living. Whether you prefer our 1-Step Evaluation, 2-Step Evaluation, or want to bypass the challenge entirely with our Instant Funding accounts, NLF offers the best conditions in the industry:
- Up to 100% Profit Splits
- Payouts on Demand
- Instant Funding Options from $10k to $50k
- Account starting from as cheap as $10
Stop trading small personal accounts. Apply your RSI strategy to a six-figure funded account and keep the profits you deserve.
More Blogs
.png)
.png)
June 6, 2026
The Cheapest Prop Firm Accounts in 2026: Giving Access to Traders from All Walks of Life
Read Story.png)
Become a Next Level Funded Trader
Receive evaluation credentials instantly and login to the dashboard.
The most trusted prop firm for serious traders. Verified payouts, transparent rules, and a founder who puts his name on every promise.
Let's talk
© Next Level Funded 2025 | All Rights Reserved