★★★★★
Rated 4.9/5 . 500+ verified traders


$450k+ Paid to traders worldwide
⚡ Industries Cheapest Instant Funding
Technical analysis is the backbone of modern day trading. While pure price action and Smart Money Concepts (SMC) have gained massive popularity, technical indicators remain vital tools for confirming trends, identifying momentum shifts, and managing risk.
However, with thousands of custom scripts available on platforms like TradingView and MetaTrader 5, new traders often suffer from "analysis paralysis"—cluttering their charts with too much conflicting information.
To pass a prop firm evaluation and secure live capital, you do not need twenty indicators; you only need a deep understanding of a select few. In this guide, we break down the best trading indicators every trader should know and how to apply them effectively to secure a funded account with Next Level Funded.
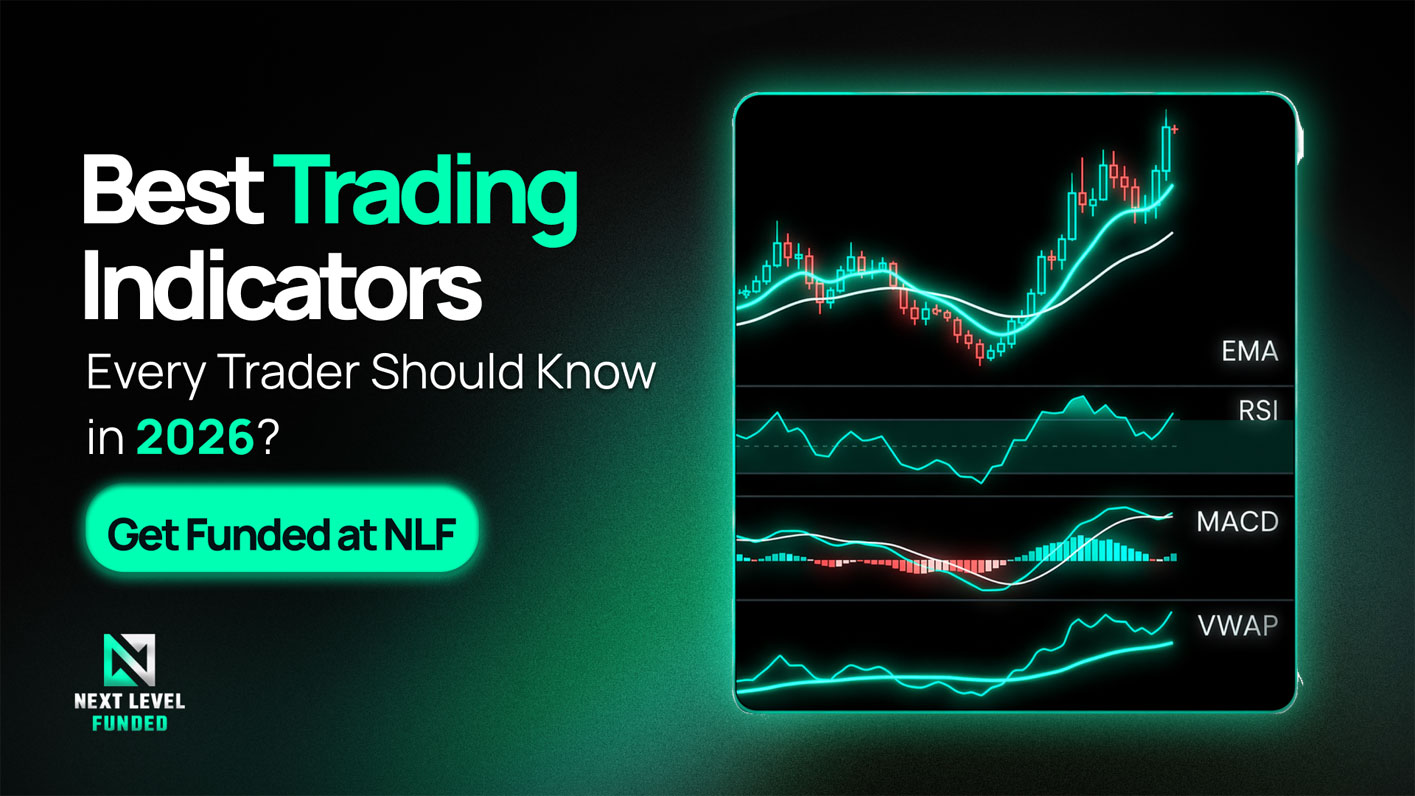
1. Moving Averages: Exponential (EMA) and Simple (SMA)
Moving averages are the foundation of trend analysis. They smooth out chaotic price data to create a single, flowing line that represents the average price over a specific period.
There are two primary types of moving averages that every trader must understand:
- Simple Moving Average (SMA): Calculates the average price over a set number of periods, giving equal weight to every candle. The SMA is excellent for identifying long-term, macroeconomic trends.
- Exponential Moving Average (EMA): Places greater mathematical weight on the most recent price data. This makes the EMA react much faster to sudden price changes, making it the preferred choice for day traders and scalpers.
How to Use Them: A common strategy is the "EMA Crossover." Traders will plot a fast-moving EMA (like the 9-period) and a slower EMA (like the 20-period). When the 9 EMA crosses above the 20 EMA, it signals a bullish momentum shift. Conversely, a cross below indicates bearish momentum.
2. Relative Strength Index (RSI)
The Relative Strength Index (RSI) is a momentum oscillator that measures the speed and change of price movements. It oscillates on a scale from 0 to 100.
The traditional interpretation of the RSI is straightforward:
- Overbought (Above 70): Indicates that an asset may be overvalued and due for a corrective pullback or reversal.
- Oversold (Below 30): Suggests that an asset may be undervalued and primed for a bullish bounce.
How to Use It: While buying simply because the RSI is below 30 is a common beginner mistake, the true power of the RSI lies in divergence. If the price is making a lower low, but the RSI is making a higher low, this "bullish divergence" often precedes a massive reversal. This is a highly effective setup for passing prop firm challenges.
3. Moving Average Convergence Divergence (MACD)
The MACD is a trend-following momentum indicator that shows the relationship between two moving averages of a security’s price. It consists of the MACD line, the Signal line, and a histogram.
The MACD helps traders identify when bullish or bearish momentum is accelerating or decelerating.
How to Use It: The most common MACD signal is the crossover. When the MACD line crosses above the Signal line, it is a bullish signal. Furthermore, when the histogram flips from red (negative) to green (positive), it visually confirms that buyers have taken control of the market.
4. Volume Weighted Average Price (VWAP)
For intraday traders, particularly those trading indices or equities, the Volume Weighted Average Price (VWAP) is arguably the single most important indicator on the chart.
Unlike standard moving averages that only calculate price, the VWAP factors in volume. It represents the true average price a security has traded at throughout the day, based on both volume and price. Institutional algorithms and large hedge funds use VWAP to determine if they are getting a "fair" price for an asset.
How to Use It: VWAP acts as a dynamic support and resistance level. If the price is above the VWAP, the intraday trend is considered bullish. If the price pulls back to the VWAP line, institutional buyers often step in to defend that level, providing a high-probability entry point for retail traders.
Indicator Comparison for Prop Trading
Execute Your Strategy with Next Level Funded
Indicators are only as good as the capital you have to trade with. Once you have mastered these essential tools and built a profitable strategy, the next step is scaling your income.
At Next Level Funded, we provide the capital you need to turn your technical analysis into substantial profits. Whether you rely on the MACD crossover or VWAP bounces, our evaluation parameters are designed to let your edge play out.
With our Instant Funding options, you can bypass the evaluation phase entirely and start trading live capital today for as little as $10. We offer a 100% profit split on select accounts, weekly payouts, and industry-leading drawdown limits.
Stop trading small personal accounts. Apply your indicator knowledge to a professional-sized account and start seeing real returns.
More Blogs
.png)
.png)
June 6, 2026
The Cheapest Prop Firm Accounts in 2026: Giving Access to Traders from All Walks of Life
Read Story.png)
Become a Next Level Funded Trader
Receive evaluation credentials instantly and login to the dashboard.
The most trusted prop firm for serious traders. Verified payouts, transparent rules, and a founder who puts his name on every promise.
Let's talk
© Next Level Funded 2025 | All Rights Reserved